Tuesday, August 22, 2006

Regional Science

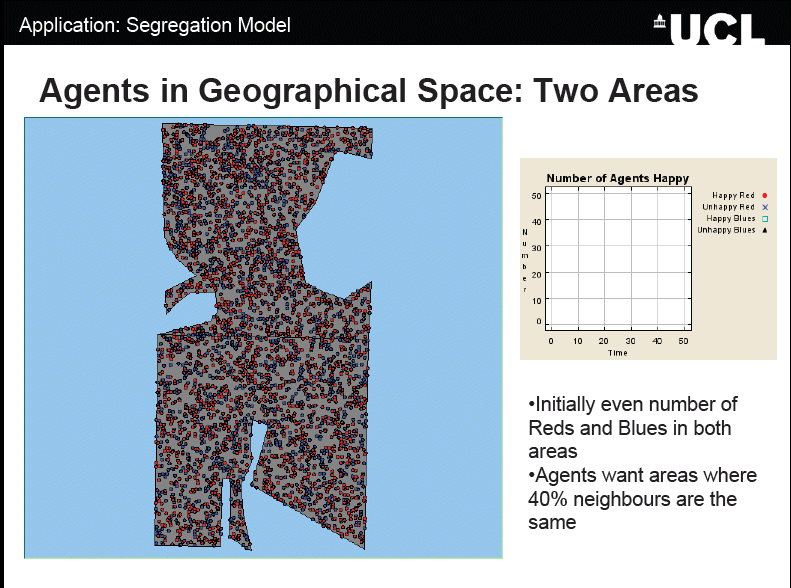
I just attended Regional Science Annual conference in Jersey, where I presented a paper entitled ‘Experimenting with cities, integrating Agent-Based Models and GIS: Applied to segregation’ The abstract of the talk was:
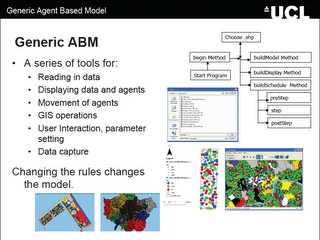
Cities are faced with many problems such as urban sprawl, congestion, crime, segregation, etc. They are also constantly changing. Computer modelling is becoming an increasingly important tool when examining how cities operate. Agent-Based Models (ABM) provide an environment to test different hypotheses and theories to urban change based on the individual behaviours of agents, thus leading to a greater understanding of how cities work.

This paper presents the development of generic agent-based simulation model for the examination of urban issues focusing on the integration of Geographical Information Systems (GIS) and ABM where space plays a central role, for past ABM have been criticised for not being spatial as they have been developed outside geography in other social sciences (Torrens 2003). The model allows for global patterns emerging from local interactions of individual agents. Using the generic framework, models can be developed rapidly to examine urban issues. One of the types of models will be presented: a segregation model. The model was created with only minor alterations to the basic model structure, highlighting how this approach can be applied to different styles of urban models.

Batty et al. (2004) write that it is hard to find clear examples of segregation process taking place, because it only becomes noticeable when it is clearly underway, and by then a detailed chronology becomes impossible to reconstruct. Schelling (1969) presented a model on the emergence of segregation where he showed that with mild preferences to locate amongst like demographic or economic activity groups, strict segregation would emerge unknowingly. This segregation is all too clear when one walks around the urban area, there are clusters of economic groups and residential groups based on ethnicity or social class.
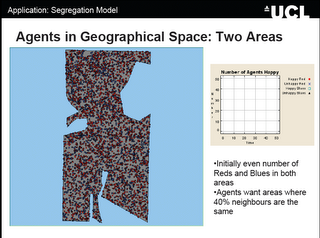
To highlight this idea of segregation based on simple tastes and preferences, a simple segregation model has been created inheriting much of the features from the generic model. Individuals are given the same initial starting conditions but different preferences for their neighbours. What is clear is that with different percentages of similarity wanted, different patterns will emerge. However these patterns change as time passes, as the agents move to find areas in which they are happy to live in, thus changing the composition of the neighbourhood and the overall appearance of the system. Unlike the traditional segregation models, space is not restricted to discrete homogenous cells, more than one agent is allowed per area, and more intelligent movement, and searching mechanisms are introduced (e.g. agents don’t just move to random locations or the nearest empty cell). System dynamics are introduced with agents entering and leaving the system. To conclude the paper will present future avenues of research.

The PowerPoint of the talk can be downloaded from here:
Wednesday, August 9, 2006

How to create a .pgm file from an .ascii file

Creating a .pgm (portable greymap) file from an .ascii (ESRI Grid format) file, and vice versa, is a very simple task; if you know how to. I stumbled across this problem when I was trying to construct an Object2DGrid within the agent-based modelling toolkit Repast. There are three ways to construct an Object2DGrid: 1) specify the X and Y dimension; 2) construct from an input stream; or, 3) construct from a file. At present only a .pgm file can be read in as a stream or from a file location. This is fine if you wish to create a very basic agent space similar to those available in the Repast demo’s (e.g. Sugarscape) using a graphic’s package (Adobe Photoshop, Paintshop Pro, or GIMP (freeware) can all save as a .pgm file format). However, what happens if you have a raster file within a GIS (e.g. a digital elevation model, DEM), and you wish to use this within you repast model. For example, ArcGIS can only export a raster file (using ArcToolbox) as an .ascii file format. This is awkward because once you have converted a file to .ascii you can no longer view, or edit the file in ArcGIS, or any graphics package. Fortunately, there is a quick solution; just alter the header of the file and change the file extension and to .pgm and you will be able to open and edit the file in a graphic package..

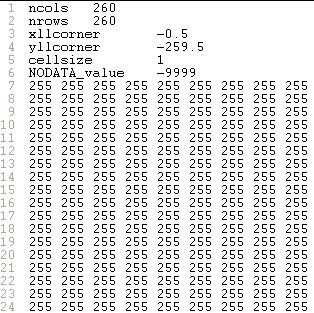
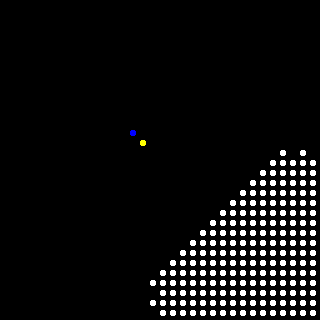
This may seem far fetch, but this situation can arise. For example, Figure 1 is a .shapefile of a building floor plan. This was converted from ‘feature to raster’ using ESRI’s ArcToolbox so the ABM could use the underlying cell values to dictate the movement of the agents (Figure 2). Unfortunately, the raster file can only be exported as an .ascii file from ArcGIS. Figure 3 is a screen capture of the file viewed as text. However, the file can be converted by altering the header in Figure 3 to the header in Figure 4, and changing the file extension from .ascii to .pgm. The value ‘P2’ in the first line is always required, and ‘260’ and ‘260’ refer to the number of columns and rows, while the value in the third line refers to the highest value within the file (for scaling the values to be displayed). The third row should be set as either: 1, 3, 7, 15, 31, 63, 127, or 255. If this value is set considerably larger than the highest value within the file there will be less differential between the values (in terms of grey) to be displayed, and this may result in the image appearing as completely black.

Figure 1: ArcGIS .shapefile of a building floor plan.
Figure 2: Original .shapefile converted to a raster.

Figure 3: Raster file exported as .ascii file format.


Figure 4: Raster file altered to a .pgm file format

Thursday, August 3, 2006

Repast Models of the Week:The SLUDGE and SluGIS models

The SLUDGE model (Simulated Land Use Dependent on Edge Effect Externalities) was developed by Dawn Parker. The combines a simple cellular automaton and agent-based model which was designed to study the joint influence of distance-dependent spatial externalities and transportation costs on patterns of land use. Further information on her work can be found at discussed in the following papers:

Parker, D. C. 1999. "Landscape Outcomes in a Model of Edge-Effect Externalities: A Computational Economics Approach", Santa Fe, NM: Santa Fe Institute Publication 99-07-051 E.
Parker and Meretsky, 2004, "Measuring Pattern Outcomes in an Agent-Based Model of Edge-Effect Externalities Using Spatial Metrics"; Agriculture, Ecosystems, and Environment 101:233-250.

A Repast model of SLUDGE has also been programmed by Robert Najlis. The source code for the original model can be downloaded from here. Alternatively if you viewing this post on a computer using windows, you can run the model directly by clicking here.

Robert Najlis has also developed a model called SluGIS which is a closely-related model of of SLUDGE. With the major distinction as it is a move away from the cellular space used in the previous model. SluGIS runs on a vector landscape. Robert Najlis has used Repast GIS functionally (and produced the same model both ESRIs and OpenMap interfaces of Repast).

A modified OpenMap version can be run by downloading the following and unzipping the following Shapefile package (download Shapefiles) and storing it to disk. Then by running the model by clicking here and choosing the shapefile you just saved to disk.

The original java files for the OpenMap and ESRI SluGIS models can be found here. A modified ESRI version which was created by Michael Leamy can be downloaded from here. All that needs to be done is to change the path names for the .shp file, the .gal file, and the refresh call. Look for this in SluGISEsri.java.

For more information on Repast GIS see the Repast website “How to use GIS data with Repast”.

Tuesday, June 27, 2006

Repast Model of the week: jEcho

jECHO, created by Brian McIndoe is a new version of the ECHO model of a Complex Adaptive System (CAS) described by Holland using Repast. The aim of the research was to seek insights into CAS behavior in an attempt to evaluate ECHO model mechanisms and properties.

Further information

Brian McIndoe site also contains a copy of the Masters dissertation which describes the analysis, design and implementation of jECHO plus some experimentation and references.

The original source code for the model can be found and downloaded by clicking here

Alternatively, to run a verision of the model click here (Sorry it will only work in Windows). For instructions on how to run a Repast model see the Repast website.

Friday, June 23, 2006

Repast Model of the Week: Repast 2D Model Template

Repast 2D Model Template model created by Michael Schippling based on uchicago.src.repastdemos.sugarscape files. Schippling, removed all but the essential model specific code, and added/edited the comments (quite useful). The source files form a minimal template for any model which uses a 2D torus consisting of a Space and a set of Agents that interact which could then be expanded upon.

About the model

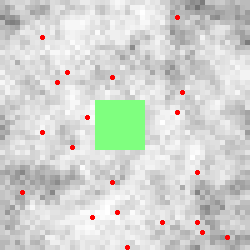
This specific model is just a set of agents that take random walks on a space which has been initialized to have areas that are not penetrable (Green Area). The two rules are that agents can't occupy the same location in the space at the same time (i.e. one agent per cell), and they can't invade any blocked areas of the space. As the agents wander they leave a trace in the space so we can see that, as Random Walk theory posits, they do indeed cover all the territory (areas becoming grey).

Figure showing the agents (red dots), the not penetrable areas (Green Area) and the space (white through to grey for the most walked areas)

The mode also utilizes Repasts Graphing functions. There are Graph and Histogram windows that plot some internal agent values. The Graph shows the total number of collisions over time, and the Histogram shows the distribution of move-directions for each step. They are examples of use, more than useful examples.


The model can also log data from each step to a file named Template_data.txt. This uses Repasts DataRecorder class. Checking the writelog entry in the Settings window before starting a run will enable the log. Again this is more for illustrative purposes than to provide useful data.

Additional Information

Further information about the model can be found here, which includes the source code and more details about the model. To run an executable of the model (if you are using a windows machine) click here.

Tuesday, June 20, 2006

Repast Model of the week: EvoTech model

EvoTech2 is an model exploring Evolutionary Technology: A Repast-Based Causal Approach. Created by Laszlo Gulyas and George Kampis. The Projects research question is “Can you evolve an increasing number of species in a developing ecosystem so that they perform an increasing range of different tasks? The authors write, that current evolutionary simulations cannot do this.” The authors come up with an alternative suggestion. To illustrate their idea they consider evolutionary technology instead of natural evolution. The ultimate goal of the project is to develop artificial organisms that perform increasingly complicated tasks. We are currently in the process of developing a simple test-bed for the causal principles.
Figure is Part of the frameset of the simulation model. It shows population numbers, surviving phenotypes, and their distribution.


The creators developed an agent-based simulation model using the RePast package. Organisms are agents that selectively feed, reproduce and die, based on their phenotypic properties described in variable length records. As adaptation progresses, new property sets extend the records, and as a result, selection can spontaneously switch between the defining properties of an interaction. The aim is to develop functionally disjoint subpopulations specialised for the use of different property sets. The initial results show the possibility of progressive evolution productive of new selection effects, as an illustration for the causal principles of embodiment.

The model has some good features, not only does it use a whole host of repasts core functions it is also clearly commented. The models also demonstrates how to add buttons to the Controller, This is extremely useful, while one can add buttons to custom actions pain these can’t be activated till the model is running. By adding extra buttons on the control bar gets around this problem.

Further Information

Further information about the model can be found on the project website. And some articles about the work here. The original source code can be down loaded from here. Alternatively to run the model on a windows machine click here.

Wednesday, June 14, 2006

GAL Files

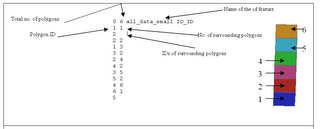
GAL files are used in the Repast when using OpenMap. GAL stands for GenePix Array List and which provides an easy way to link between location and the quantitative values that represent each agent (polygon). Basically it is a text file with specific information and used within the program to create an array list. They are easily created using VB in ArcGIS. The GAL file contains information about the number of polygons In the case below it is 0 to 6(the last polygon in the list), the file name (all_data_small) and the column name (ID_ID) where the polygon id can be found (See diagram below). Alternatively can be created using GeoDa, a freely downloadable program designed to implement techniques for exploratory spatial data analysis (ESDA) on lattice data (points and polygons).

An annotated example of a .GAL file and the associated shapefile with the polygons numbered accordingly.